 orca.flo
See how your workflows perform
Every workflow shows how many customers went through it and what happened at each step, right on the canvas.
Updated
Open the numbers
Open a workflow
In Workflows, click the workflow’s name.
Click Analytics
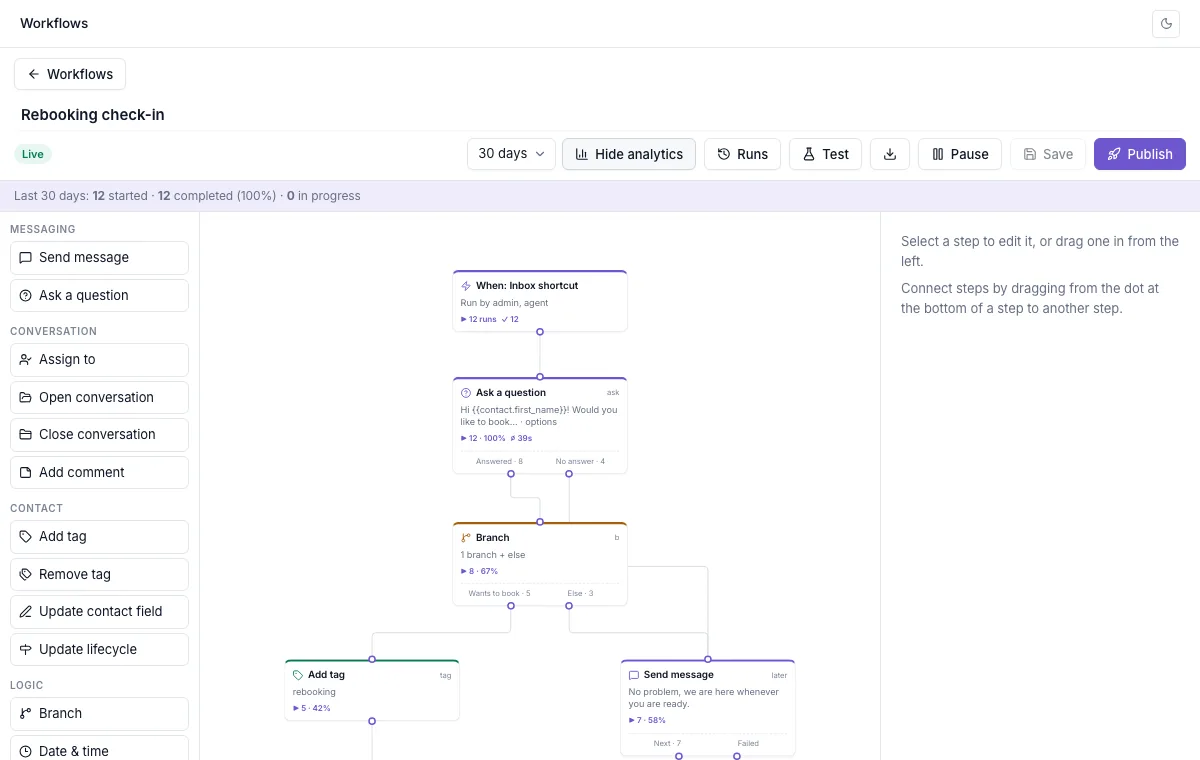
Choose the last 7, 30 or 90 days. A summary appears at the top and numbers appear on every step.
What the numbers mean
▶ 12 · 100%
How many customers reached this step, and what share of everyone who started.
Next to each output
How many went each way, for example 8 answered and 4 didn’t.
⌀ time
On questions and waits: how long customers took on average.
⏳ and ⚠
How many are waiting at the step right now, and how many times the step failed.
Where to look next
Lots of customers not answering a question? Make it shorter or offer choices. A step that fails? Open Runs to see why for each customer.
If you don’t see this in your panel yet, email support@orcaflo-panel.com and we’ll switch it on for your business.
Questions
No. Test runs never send anything and are not counted.